Read Article Fallout Overseers, Ranked By How Much We’d Trust Them Not To Kill Us Category: Features Features Fallout Overseers, Ranked By How Much We’d Trust Them Not To Kill Us Lewis Rees Lewis Rees Apr 19, 2024
Read Article 5 Helpful Fallout 76 Tips and Tricks (2024) Category: Features Features 5 Helpful Fallout 76 Tips and Tricks (2024) Ali Taha Ali Taha Apr 18, 2024
Read Article Assassin’s Creed Red Faces a Huge Challenge, It’s Been Done Already Category: Features Features Assassin's Creed Assassin's Creed Assassin’s Creed Red Faces a Huge Challenge, It’s Been Done Already Ishmael Romero Ishmael Romero Apr 17, 2024
Read Article The Top 10 Worst Vaults in the Fallout Universe Category: Features Features The Top 10 Worst Vaults in the Fallout Universe Lewis Rees Lewis Rees Apr 16, 2024
Read Article Top 10 Best Games Like Manor Lords Category: Features Features Top 10 Best Games Like Manor Lords Aleksa Stojkovi? Aleksa Stojkovi? Apr 16, 2024
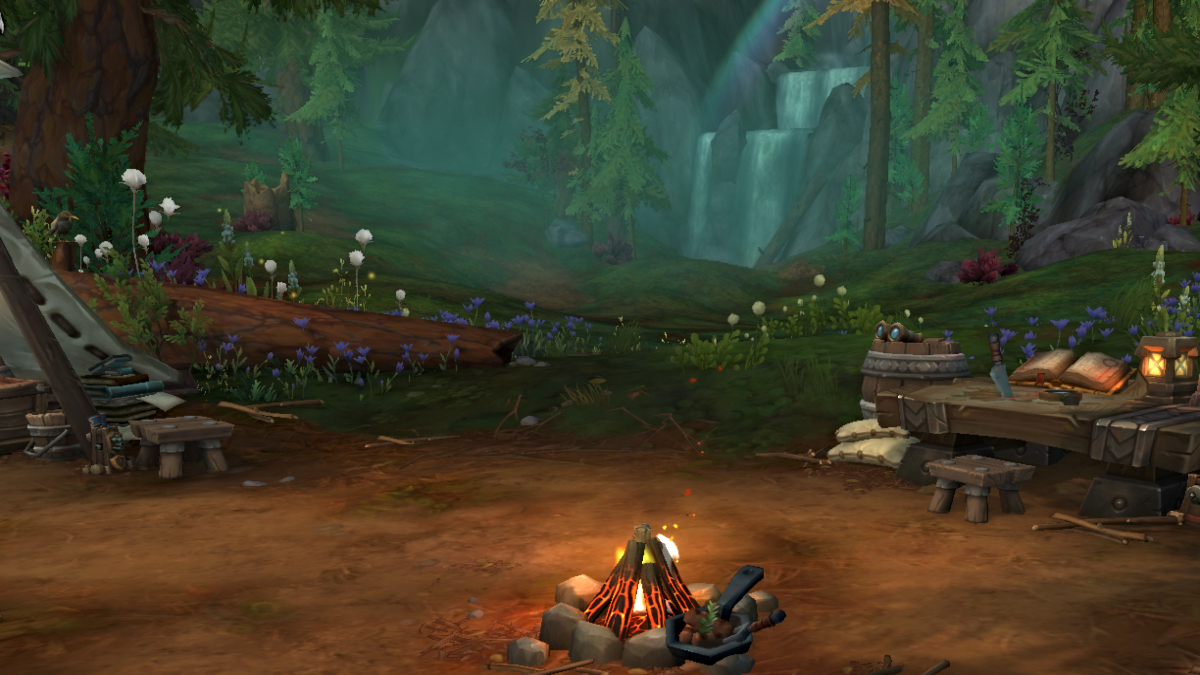
Read Article WoW Developers on How They’re Going the Extra Mile With Dynamic Flight in The War Within Category: News News WoW Developers on How They’re Going the Extra Mile With Dynamic Flight in The War Within Stephanie Watel Stephanie Watel Apr 17, 2024
Read Article Warbands Are Coming to World of Warcraft: The War Within, Making Progression Easier Category: News News Warbands Are Coming to World of Warcraft: The War Within, Making Progression Easier Stephanie Watel Stephanie Watel Apr 17, 2024
Read Article Solo Leveling: Arise Finally Has a Global Release Date Category: News News Solo Leveling: Arise Finally Has a Global Release Date Luke Hinton Luke Hinton Apr 17, 2024
Read Article All Goddess of Victory: Nikke Codes (April 2024) Category: Guides Guides Codes Codes All Goddess of Victory: Nikke Codes (April 2024) Here's a list of all available codes in Goddess of Victory: Nikke. Zhiqing Wan Zhiqing Wan Apr 20, 2024
Read Article Onepiecedle Answers Today | No Spoilers (April 20) Category: Guides Guides Onepiecedle Answers Today | No Spoilers (April 20) Aleksa Stojkovi? Aleksa Stojkovi? Apr 20, 2024
Read Article All Anime Spirits Codes (April 2024) Category: Codes Codes Guides Guides Roblox Roblox All Anime Spirits Codes (April 2024) Brady Klinger-Meyers Brady Klinger-Meyers Apr 20, 2024
Read Article LoLdle Answers: All Modes & No Spoilers (April 20) Category: Guides Guides LoLdle Answers: All Modes & No Spoilers (April 20) Aleksa Stojkovi? Aleksa Stojkovi? Apr 20, 2024
Read Article Roblox Anime Champions Simulator (ACS) Codes (April 2024) Category: Codes Codes Guides Guides Roblox Roblox Roblox Anime Champions Simulator (ACS) Codes (April 2024) Gabriela Jessica Gabriela Jessica Apr 20, 2024
Read Article How to Get Oni Race in Legacy Piece Category: Guides Guides How to Get Oni Race in Legacy Piece Luke Hinton Luke Hinton Apr 19, 2024
Read Article All Bankai Progression in Type Soul Guide Category: Guides Guides All Bankai Progression in Type Soul Guide Aleksa Stojkovi? Aleksa Stojkovi? Apr 19, 2024
Read Article Hero Clash Codes | Free Diamonds (April 2024) Category: Guides Guides Codes Codes Hero Clash Codes | Free Diamonds (April 2024) Aleksa Stojkovi? Aleksa Stojkovi? Apr 19, 2024
Read Article Maple Rush Codes (April 2024) Category: Guides Guides Codes Codes Maple Rush Codes (April 2024) Aleksa Stojkovi? Aleksa Stojkovi? Apr 19, 2024
Read Article Free Monopoly GO Dice Links (April 19, 2024) Category: Codes Codes Guides Guides Free Monopoly GO Dice Links (April 19, 2024) Zhiqing Wan Zhiqing Wan Apr 19, 2024
Read Article Shakes and Fidget Codes (April 2024) Category: Codes Codes Guides Guides Shakes and Fidget Codes (April 2024) Gabriela Jessica Gabriela Jessica Apr 18, 2024
Read Article Fairy Tail Fierce Fight Codes (April 2024) Category: Codes Codes Fairy Tail Fierce Fight Codes (April 2024) Aleksa Stojkovi? Aleksa Stojkovi? Apr 15, 2024
Read Article Fallout Season One Review – Inconsistent Wasteland Category: Reviews Reviews Fallout Season One Review – Inconsistent Wasteland Tom Hopkins Tom Hopkins Apr 10, 2024 3 stars
Read Article Open Roads Review – A Disappointing Road Trip Category: Reviews Reviews Open Roads Review – A Disappointing Road Trip Tom Hopkins Tom Hopkins Mar 27, 2024 3 stars
Read Article South Park: Snow Day Review – Chaotic Co-op Fun Category: Reviews Reviews South Park: Snow Day Review – Chaotic Co-op Fun Grace Black Grace Black Mar 25, 2024 4 stars
Read Article All Goddess of Victory: Nikke Codes (April 2024) Category: Guides Guides Codes Codes All Goddess of Victory: Nikke Codes (April 2024) Here's a list of all available codes in Goddess of Victory: Nikke. Zhiqing Wan Zhiqing Wan Apr 20, 2024
Read Article Onepiecedle Answers Today | No Spoilers (April 20) Category: Guides Guides Onepiecedle Answers Today | No Spoilers (April 20) I doubt even Vegapunk could get all these right. Aleksa Stojkovi? Aleksa Stojkovi? Apr 20, 2024
Read Article All Anime Spirits Codes (April 2024) Category: Codes Codes Guides Guides Roblox Roblox All Anime Spirits Codes (April 2024) Take on the spirits of anime with free codes! Brady Klinger-Meyers Brady Klinger-Meyers Apr 20, 2024
Read Article LoLdle Answers: All Modes & No Spoilers (April 20) Category: Guides Guides LoLdle Answers: All Modes & No Spoilers (April 20) A LoLdle a day keeps losers queue away. Aleksa Stojkovi? Aleksa Stojkovi? Apr 20, 2024
Read Article Roblox Anime Champions Simulator (ACS) Codes (April 2024) Category: Codes Codes Guides Guides Roblox Roblox Roblox Anime Champions Simulator (ACS) Codes (April 2024) Get your free Diamonds and Boosts! Gabriela Jessica Gabriela Jessica Apr 20, 2024
Read Article How to Get Oni Race in Legacy Piece Category: Guides Guides How to Get Oni Race in Legacy Piece Oni is OP! Luke Hinton Luke Hinton Apr 19, 2024
Read Article All Bankai Progression in Type Soul Guide Category: Guides Guides All Bankai Progression in Type Soul Guide Let's bring out the true power of your Zanpakutō. Aleksa Stojkovi? Aleksa Stojkovi? Apr 19, 2024
Read Article Roblox Pet Simulator 99 Value List Category: Guides Guides Roblox Roblox Roblox Pet Simulator 99 Value List Here kitty, kitty, kitty... Nenad Mili?evi? and others Nenad Mili?evi? and others Apr 19, 2024
Read Article Wuthering Waves Tier List (April 2024) Category: Guides Guides Wuthering Waves Tier List (April 2024) Who is the best main to take with us? Damiano Gerli Damiano Gerli Apr 19, 2024
Read Article A Touch of Darkness Series Order Category: Guides Guides A Touch of Darkness Series Order Inside the hit series Lewis Rees Lewis Rees Apr 19, 2024
Read Article Type Soul Trello V2 Link (April 2024) Category: Guides Guides Roblox Roblox Type Soul Trello V2 Link (April 2024) Luke Hinton Luke Hinton Apr 19, 2024
Read Article Hero Clash Codes | Free Diamonds (April 2024) Category: Guides Guides Codes Codes Hero Clash Codes | Free Diamonds (April 2024) Aleksa Stojkovi? Aleksa Stojkovi? Apr 19, 2024
Read Article What Are the Waffle Answers Today? (April 2024) Category: Guides Guides What Are the Waffle Answers Today? (April 2024) Dylan Chaundy and others Dylan Chaundy and others Apr 19, 2024
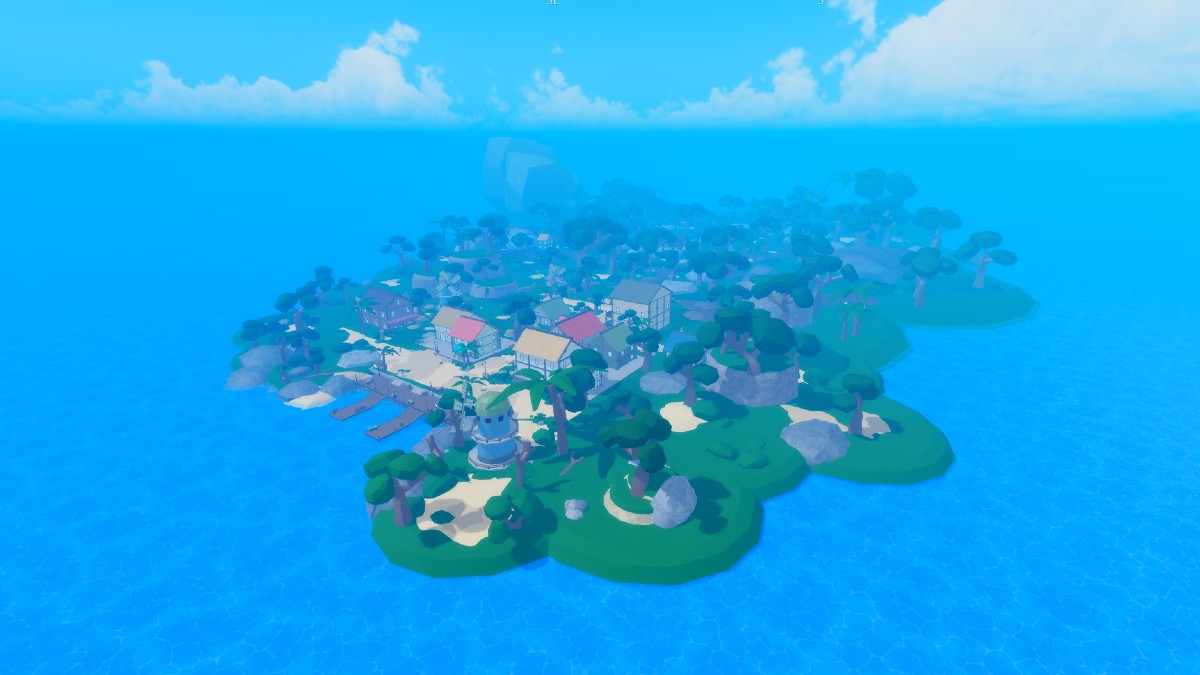
Read Article Legacy Piece Map Guide Category: Guides Guides Roblox Roblox Legacy Piece Map Guide Luke Hinton Luke Hinton Apr 17, 2024
Read Article Legacy Piece Trello Link Category: Guides Guides Roblox Roblox Legacy Piece Trello Link Luke Hinton Luke Hinton Apr 15, 2024